The Ultimate Power BI Cheat Sheet .A Guide for Modern Data Professionals
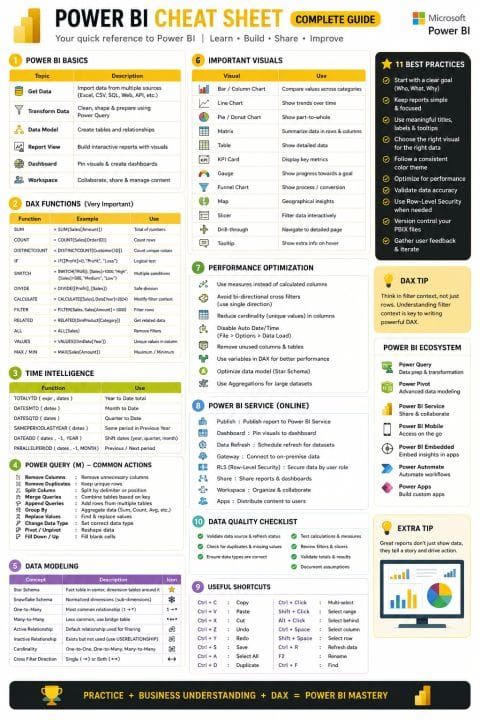
Power BI has become the heartbeat of modern analytics—not because of flashy visuals, but because it transforms messy, disconnected business data into clear, confident decisions.
Whether you're a beginner building your first report or an enterprise developer architecting scalable models, mastering the fundamentals is what separates dashboards that look good from dashboards that drive action.
This Power BI Cheat Sheet brings together the core concepts, essential DAX, modeling principles, and best practices every analyst should know.
🔶 1. Power BI Basics — The Foundation of Every Report
Power BI’s strength starts with a simple workflow:
- Get Data — Connect to Excel, CSV, SQL, APIs, SharePoint, and more
- Transform Data — Clean, shape, and prepare using Power Query
- Build the Data Model — Create tables, relationships, and hierarchies
- Design Reports — Use visuals to tell a story
- Publish & Share — Deploy to Power BI Service for collaboration
- Manage Workspaces — Control access, refreshes, and governance
Mastering these basics ensures your reports are not just functional — they’re reliable.
🔶 2. Essential DAX Functions — The Language of Insights
DAX is where Power BI becomes powerful. A few functions deliver 80% of the value:
- SUM() — Total values
- COUNT() / DISTINCTCOUNT() — Count items or unique values
- IF() / SWITCH() — Logical branching
- DIVIDE() — Safe division with zero handling
- CALCULATE() — The most important DAX function; modifies filter context
- FILTER() — Row-level filtering
- RELATED() — Lookup from related tables
- ALL() / VALUES() — Control filter behavior
- MAX() / MIN() — Extremes for KPIs
If you understand filter context, row context, and CALCULATE(), you’re already ahead of most users.
🔶 3. Time Intelligence — Analyze Trends Like a Pro
Business leaders care about trends, not snapshots. Time intelligence functions help you answer:
- How are we performing this month vs last month?
- What’s our Year‑to‑Date progress?
- How does this quarter compare to last year?
Key functions include:
- TOTALYTD(), DATESMTD(), DATESQTD()
- SAMEPERIODLASTYEAR()
- DATEADD()
- PARALLELPERIOD()
These unlock true business storytelling.
🔶 4. Power Query — Clean Data, Clean Insights
Power Query is your data preparation engine. Common actions include:
- Remove duplicates
- Split or merge columns
- Change data types
- Group By
- Pivot/Unpivot
- Fill down/up
A clean dataset is the difference between a fast report and a frustrating one.
🔶 5. Data Modeling — The Secret to Fast, Accurate Reports
Most Power BI problems come from poor data models, not DAX.
Core modeling principles:
- Star Schema — Fact table in the center, dimensions around it
- Snowflake Schema — Normalized dimensions
- One‑to‑Many relationships — The standard
- Active vs Inactive relationships — Use
USERELATIONSHIP()when needed - Cardinality — Reduce unique values for performance
- Cross‑filter direction — Prefer single direction
A great model makes DAX simpler, visuals faster, and refreshes smoother.
🔶 6. Visuals That Matter — Tell the Right Story
Power BI offers many visuals, but the best analysts choose intentionally:
- Bar/Column Charts — Compare categories
- Line Charts — Show trends
- Matrix/Table — Detailed analysis
- KPI Cards — Highlight key metrics
- Maps — Geographic insights
- Funnel — Process stages
- Slicers — Interactive filtering
Great visuals don’t overwhelm — they guide.
🔶 7. Performance Optimization — Build Reports That Scale
A slow report kills adoption. Follow these best practices:
- Use measures, not calculated columns
- Avoid bi‑directional filters
- Reduce cardinality
- Disable Auto Date/Time
- Use variables in DAX
- Build a Star Schema
- Use aggregations for large datasets
Performance is a feature — treat it like one.
🔶 8. Power BI Service — Where Collaboration Happens
Once published, Power BI Service unlocks:
- Dashboards
- Scheduled refresh
- Gateways
- Row‑Level Security (RLS)
- Workspaces
- Apps for distribution
This is where your report becomes a business asset.
🔶 9. Useful Shortcuts — Work Faster
A few shortcuts that save time:
- Ctrl + D — Duplicate
- Ctrl + R — Refresh
- Ctrl + A — Select all
- Ctrl + Shift + L — Multi‑select
- Ctrl + Space / Ctrl + Enter — Select column/row
Small efficiencies add up.
🔶 10. Data Quality Checklist — Trust Your Numbers
Before publishing:
- Validate data sources
- Check duplicates & missing values
- Confirm data types
- Test measures
- Review slicers & filters
- Document assumptions
A trusted report is a used report.